

Start with a core of Index Funds
A previous post described in great detail how to get started investing in Index funds. For most of us, filling up our entire stock allocation with a single S&P500 index fund is just fine.
- The S&P500 represents 500 of the “top” US companies and is therefore well-diversified
- Most of the time, the S&P500 (or any other index) beats the performance of any actively managed fund
- Fund fees are ridiculously low. The index fund manager doesn’t need to do much work, except match the stocks within an index. At present, fees on the most cost-effective mutual funds and ETFs range from zero (yes zero!) to 0.04% of your return. That’s a lot cheaper than the 1-2% (or more) expense ratio seen on actively managed funds.
- Investing is easy. Pick an index fund with a low expense ratio and you’re done.
However, you may wish to devote a portion of your stock portfolio to an actively managed fund.
- You may have a personal preference for investing in a particular style, sector, or set of values
- Although most funds fail to beat the S&P500, there are a few that do beat it
Investing outside an index fund will take a bit more research, but in the end, it maybe worth it if it meets your investing objectives.
Investment styles
On Morningstar and any financial institution website that offers a selection of funds, there is a three-by-three grid of the “investment style” of a particular fund. Here is the style of the S&P500 index:
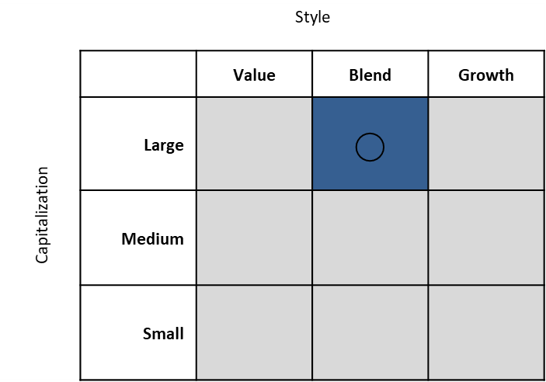
The S&P500 is an example of a “large-cap blend”
The investments style is important as different types of companies tend to behave differently under different market conditions. For the best diversification, hold a mix of everything.
Small-, Medium- and Large-cap
Market cap is the size of the company measured as the total dollar market value of a company’s outstanding shares. In other words, if you wanted to buy the company outright, how much would you need to spend.
As companies are getting bigger and bigger the definition tends to move north, but presently large-cap companies are defined as those over the size of $10 billion. Mid-caps are $2-10 billion, and small-caps are less than $2 billion.
As the grid above indicates, the S&P500 is mostly composed of large-cap stocks. However, the smallest is “only” $2.8 billion, so there are a few mid-caps included in the S&P500.
As there is more money with the large-caps they move the market most of the time.
The S&P500 is very biased towards large companies. For more mid- and small-cap exposure there are index funds that follow the Russell 2000 or the “extended market”, or you may prefer an actively managed fund that can quickly switch in and out of exposure to volatile small companies.

Photo by Sean Foley on Unsplash
Growth vs Value
As the name implies, growth stocks are of companies actively growing. Any profits the company earns are used to expand the business, either into more products and services and/or larger markets. Most small- and mid-cap companies are younger and in this stage of business development.
However, when a company matures, they may instead decide to give their profits back to the shareholders in the form of a dividend. These companies tend to be large-caps.
Value stocks are perceived to be a “good value”, relative to the current price. Value is measured in several ways, including the future yield of dividends.
Not always, but older large dividend-generating companies are generally considered value investments.
Another measurement that value investors evaluate is “P/E”, or price to earnings ratio. A low price relative to earnings is considered a good value.
In contrast, growth stocks tend to have a very high P/E. If the company is very new, they may have no earnings at all!
“Momentum” vs “underpriced”
Value investors and Growth investors follow very different philosophies. Value investors are looking for a “good deal”, or a stock that is “underpriced” today, relative to what it can make in the future from both price and compounded dividends.
Growth investors prefer to invest in companies that are already growing. A high P/E is not a concern. They are betting that growth companies will continue to grow even more. Stocks have “momentum”; due to mob psychology, if the price is going in one direction, either up or down, it tends to continue in that direction.
Growth stocks are more volatile than Value stocks. There are a lot of small companies that will never make it; likewise, a few rare ones will become the next Twitter. Growth stocks make more, but they also can lose more.
Growth companies are usually small, but there are notable exceptions: the FANG stocks of Facebook, Apple, Amazon, Netflix, and Google (Alphabet) are all huge, but continue to grow.
For the last decade or so Growth stocks have significantly outperformed Value stocks. But that could change. If your stock portfolio is intended for the very long-term, then you should be diversified in both.
The S&P500 is a mix of both. If you’re a Growth investor you may wish to supplement your core Index holding with a growth-oriented fund. Likewise, if you’re a Value investor, you may wish more value exposure.
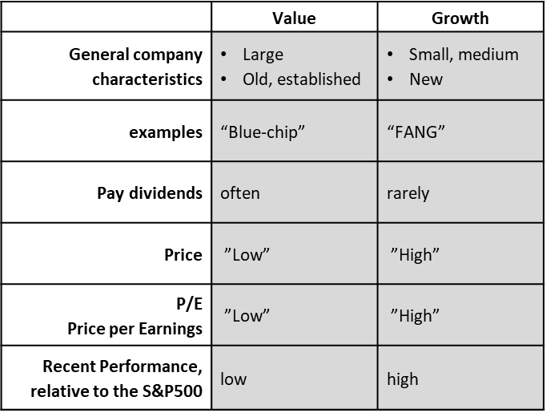
General characteristics of Value and Growth stocks. (As always, there are exceptions.)

Sector exposure
All companies can be divided into one of eleven different sectors based on what type of product or service is provided. Below are the eleven sectors, plus the present breakdown within the S&P500:
- Information Technology, 21.4%
- Healthcare 14.6%
- Financials 13.2%
- Consumer Discretionary 10.2%
- Communications Services 9.9%
- Industrials 9.5%
- Consumer Staples 7.2%
- Energy 5%
- Utilities 3.2%
- Real Estate 3%
- Materials 2.7%
Each of these sectors behaves differently in different markets. When life is good, Information Technology and Financials kick butt. However, when the market starts to get nervous, investors move to “defensive” sectors such as Consumer Staples and Utilities. When life is not so good, we may not buy the next iPhone, but we still need groceries and electricity.
Like everything in the market, the more risk you take, the better the return. Information Technology has the best return but is the first to crash. On the other end of the spectrum, utilities have probably the worst return but are also the most stable.
If you are an aggressive investor with a high risk tolerance, you may be more comfortable adding exposure to Information Technology, Healthcare, Financials, and Consumer Discretionary. If you are risk-averse you may wish more exposure to defensive sectors.
Socially responsible investing
Do the companies you invest in share your values? Do you wish to support only those companies? Environment, Social, and Governance (ESG) are three areas where companies, and the funds that purchase their stock, can be evaluated.
- Environmental criteria include energy use, carbon emissions, pollution, and treatment of animals
- Social criteria include the health and safety of employees and customers, diversity, and support of local communities
- Governance criteria include transparent accounting, a diverse board, and processes to avoid corruption
A Fund may have a “mandate” to invest in only companies that follow ESG principles. Likewise, there are methods of rating funds based on their purchases of ESG company stock. The good news is that ESG funds have performance as good or better than non-ESG funds.
Like their “star” rating (see below), Morningstar has a “globe” rating of 1-5, with five the best.
Our favorite index, the S&P500 rates only a mediocre 3, on the globe scale. You can do better!
Many ESG-style indexes have been created recently. Once indexes are created, available mutual funds and exchange-traded funds (ETFs) aren’t far behind.
MSCI has created several ESG indexes, that also include “Themes” that exclude coal, fossil fuels, or tobacco
STOXX also has several ESG Indexes, which additionally exclude involvement in controversial weapons, tobacco, and place a limit on thermal coal. FlexShares sells the ETF “ESG” that follows the STOXX ESG Impact Index.
FTSE has three “Global Choice” indexes of US companies, excluding those involved in non-renewable energy, vice products, weapons, controversial conduct and diversity practices.
Vanguard’s ETF “ESGV” follows one of these indexes.
The ETF “SPYX” tracks the S&P500 Fossil Fuel Free index
The ETF “WOMN” tracks the performance of the Morningstar Women’s Empowerment Index
The ETF “PRID” tracks the performance of the UBS LGBT Employment Equality Index
As ESG investing becomes more popular, even more choices will become available.

Image by Frank Winkler from Pixabay
Performance measures
If you are going to invest in a non-index fund, ideally that fund should beat the S&P500. Or if it doesn’t beat the index, there should be less risk involved.
All of the information below should be easily available from your financial institution’s website.
Star Rating
If you are hunting for fund candidates, one of the first criteria should be the Morningstar rating. The Morningstar “star” rating gives a fund 1-5 star with five the highest performing. The rating is an aggregate score based on the price performance of the last three, five, and ten years.
At the moment, the S&P500 has rated four stars, so any candidate for further analysis should rate at least a four.
You could stop there. Most 4-5-star funds will perform just fine.
However, do check that you aren’t simply duplicating the S&P500 with another “large-cap” fund, especially one with a higher expense ratio.
Alternatively, you can take a deeper dive into the tab labeled “performance & risk” (on your financial institution’s website) which provides more measurements on your candidate fund.
Return
The first thing you’ll look at is the actual return of the fund over the last year, 3-years, 5-years, or ten years.
Don’t necessarily go with the fund with the highest return. Odds are, that fund is taking on more risk (see below).
Given how the market, in general, has performed over the last decade, did the fund perform consistently? If there’s been a bad year for the market, a bad year for the fund is expected, but otherwise, performance should be as good or better than the S&P500 over multiple timeframes.
Alpha
Alpha indicates the excess performance of the fund compared to the benchmark index, usually the S&P500
Obviously, the S&P500 has an alpha of zero.
It may vary, but like most of the measurements described below, alpha is based on the performance of the last three years.
If a fund has an alpha of 2% and the S&P500 has a return of 8%, then the fund returned 10% or 2% above the benchmark of 8%.
Should you always purchase a high alpha fund? Not so fast. . . There may be a reason for the high alpha, namely the fund may have a habit of investing in riskier assets.
These riskier stocks have paid off well in the past (three years) but may not necessarily repeat that performance moving forward.
Therefore, it’s important to also look at risk.

Image by Free-Photos from Pixabay
Risk Measurements
Beta
Beta measures how volatile the fund is relative to the benchmark
Volatility is a measure of relative risk. The S&P500 has a beta of 1.0 as it is the benchmark.
A fund with a beta of 1.2 would move 20% more, in either direction, than the S&P500. So, if the S&P500 is up 10% for the year, this fund would be up 12%. Likewise, if the S&P500 is down 5%, this fund would be down 6%.
Treasuries barely move at all and have a beta closer to zero. Some assets are negatively correlated and may have a negative beta. When the market is down, they are up, and vice versa.
If you are risk-averse look for “low beta” funds.
Standard Deviation
Unlike beta, which measures risk relative to the market benchmark…
Standard deviation measures variability, or absolute risk
If you recall your statistics, when it comes to standard deviation, 68% of observations fall within one standard deviation, 95% fall within two standard deviations, and 98% fall within three standard deviations.
Right now, the three-year average of the S&P500 standard deviation is a little over 12%.
In other words, there is a 68% probability that the S&P500 performance at the end of this year will be somewhere in the range of negative 12% to positive 12%. (And a 1 minus 68%, or 34% chance this year’s return will fall outside of that range.)
If your candidate fund has a higher standard deviation than 12, you are taking on more risk than your S&P500 index fund.
Those risk-averse should look for a fund with a lower standard deviation.
Sharpe Ratio
The Sharpe ratio puts it all together: it takes price performance, subtracts the risk-free rate (usually 2-3 percent) and divides by the standard deviation.
Sharpe ratio is performance per unit of risk
Right now, the three-year average of the Sharpe ratio of the S&P00 is around 1%.
Of all the indicators, Sharpe ratio may be the most useful as it directly gives you your “bang for your buck”. Are you being rewarded for the risk you are taking?
Look for a Sharpe ratio higher than that of the S&P500.

Image by Dimitris Vetsikas from Pixabay
Fund manager tenure
Who is the fund manager(s) and how long have they overseen the fund? If a fund has had a stellar performance in the past and that fund manager has retired, then the new person may not necessarily be able to match past performance.
Obviously, the experienced fund manager may not be able to match past performance either.
Don’t forget about the expense ratio
As was mentioned above, index funds are ridiculously cheap. An actively managed fund will require more work and you will be charged accordingly.
However, there’s no need to be excessive. You should be able to find reasonable funds with less than a 1% expense ratio.
To summarize, you can choose actively managed funds that align with your investing style, values, and risk tolerance.
Use the tools provided by your financial institution to evaluate return, plus performance and risk measurements including alpha, beta, standard deviation, and Sharpe ratio.
Good luck!
Before investing, does an actively-managed fund meet your criteria:
- Small-, medium-, or large-cap
- Growth or value
- Sector exposure
- Socially responsible
- Morningstar “star” rating
- Return
- alpha
- beta
- standard deviation
- Sharpe ratio
- Fund manager tenure
- Expense ratio
Additional reading:
- Index Fund Investing for Beginners. Get started saving for your long-term financial goals
- Invest Your Savings with Socially Responsible Funds. How to identify and evaluate ESG funds
- The Money Checklist. Eight steps to achieve your savings goals and financial plan
Top photo credit: Denys Nevozhai on Unsplash
This information has been provided for educational purposes only and should not be considered financial advice. Any opinions expressed are my own and may not be appropriate in all cases. All efforts have been made to provide accurate information; however, mistakes happen, and laws change; information may not be accurate at the time you read this. Links are included for reference but should not be considered an implied endorsement of these organizations or their products. Please seek out a licensed professional for current advice specific to your situation.

Liz Baker, PhD
I’m an authority on investing, retirement, and taxes. I love research and applying it to real-world problems. Together, let’s find our paths to financial freedom.
