

How big is the stash, and how much do you need to save to get there?
The beach oasis beckons. . . One day I’d like to go there and not come home. All of us would like to someday call it quits and know that we never have to work again (unless, of course, we want to).
Some of us call this “retirement”; some of us call this “financial freedom”. Either way, you need enough money stashed away to live off without depleting it all before you die.
If you have social security and a pension, you’re golden. But if you’re too young and/or your annual living expenses too high, then you need to rely on your savings and the income that savings can generate over the next many decades.
At present, you have two math “problems” (pun intended). First, how big does this stash need to be? And second, how much do you need to save annually to get this stash to the right size within your designated timeframe?
Annuity Method
One of the standard methods for calculating retirement is the annuity method.
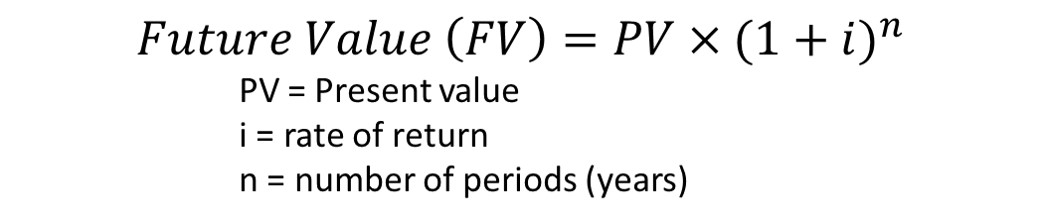
Because returns compound over time, this method relies on both the Future value (FV) formula and the related annuity formula. These formulas are used to calculate the time value of money. You may use your handy HP calculator (like I do) or simply use an online version.
Note that many online retirement calculators incorporate all of the questions below in one tidy place. So, feel free to skip ahead to the next section. . . I won’t mind.
The math goes something like this:
1. Calculate how much you need to live on per year, in today’s dollars.
There are various ways to do this, but the easiest is to take your current salary and subtract expenses that are going away (savings, FICA, work clothes, etc.) and add expenses that will increase (travel, medical, long-term care insurance, etc.). It may end up being around 80-100% of your current salary. Or if you’re young and are looking forward to a nicer lifestyle, it could be higher. . .
2. Subtract guaranteed income
This is where you subtract social security, a pension (if you have one), and income from an annuity (if you have one.)
Depending on how cynical you are on the topic of whether social security will still be viable when you reach retirement age, you may wish to subtract only a portion, say 75% of the expected amount.
https://www.ssa.gov/benefits/retirement/estimator.html
What you have left is the amount you need to live on per year that needs to come from your own savings.

Image by Luisella Planeta Leoni from Pixabay
3. Adjust this annual amount for inflation
Let’s say after subtracting my theoretical social security, I need 50K to live off this year (including taxes), but I’m not retiring for another 20 years. Thanks to inflation, that 50K won’t have the same purchasing power it does today.
To calculate the new amount, use the FV formula but use the rate of inflation as the annual interest rate. (Starting value or PV = 50K, interest or i = inflation rate, time or n = 20; solve for future value or FV.)
What rate do you use for inflation? Between 1914 and today, inflation has averaged 3.2%. However, more recently, inflation has been much less, currently 1.8%.
So, if you’re five years away, 2% may be fine, but any longer and a conservative 3.5% may be warranted.
My 50K will need to be $99K in 20 years to have the same purchasing power based on a 3.5% inflation rate. That’s almost double.
Ouch.
4. Calculate how much savings you need at your retirement date
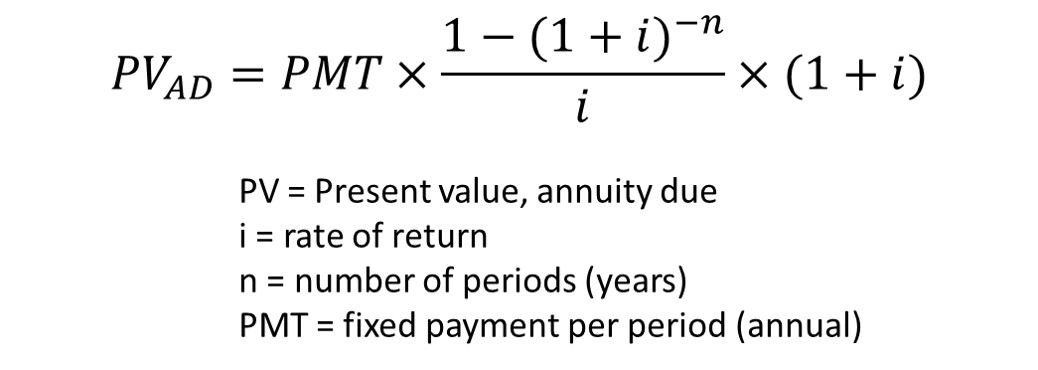
For this you need to use the annuity formula to calculate the starting value (PV) on the day you retire, assuming your money lasts your expected remaining lifespan (n) and therefore is zero on your deathbed (FV=0). The “payment” or PMT will be your inflation-adjusted annual amount calculated in the last step.
There are ways to modify this calculation to include money left over for the grandkids, but we’ll skip that for now.
Since inflation doesn’t go away during retirement, you need to use a rate of return that is adjusted for inflation. Using the calculation below, if you believe you can make 6% before inflation, then use 2.4% in the annuity calculation.

You’re still actually making 6%, but the annual payment to yourself (the 99K) is going up each year. It will more than double and then some. In other words, part of your earnings each year is needed to pad the larger stash to account for inflation.
Also, in this step, use an “annuity-due” calculation rather than an “ordinary” annuity. This is because you need your money at the beginning of the year, not at the end. In other words, you need to save more overall, as the money you’re paid at the beginning of each year doesn’t have that year to compound.
The online annuity calculator listed above doesn’t do this type of math, but I have my HP calculator. (Excel can also be programmed accordingly.) Let’s say I plan to live 30 years in retirement, which is “n”. 99K needed annually (PMT), with a 2.4% inflation-adjusted return, and an FV=0, results in a starting value of. . .
2.15 million. Yup.
We’re not done yet. Now how much do you need to save in order to have that amount ready to go at your retirement date?

Photo by Valeriia Miller from Pexels
5. Calculate annual savings needed to achieve your retirement target amount
We go back to our previous ordinary annuity calculation.
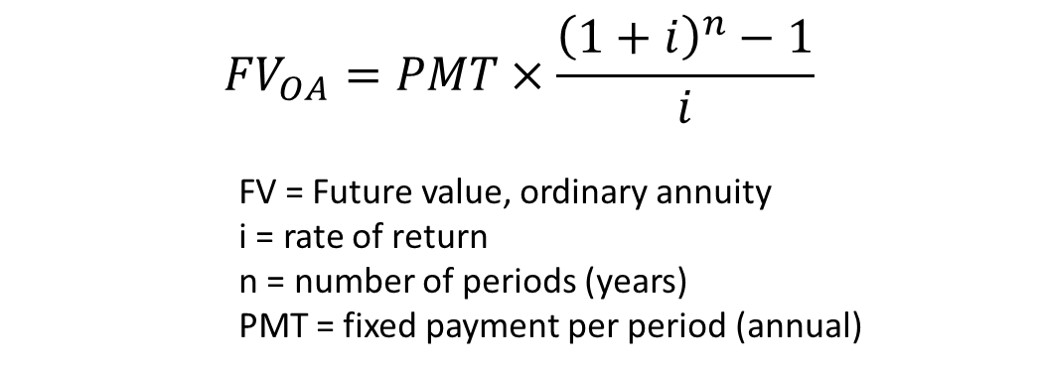
My future value, or FV, is the 2.15 million calculated in the last step; n is the number of years I must save or 20 in our example; and interest, or i, is my current savings rate of return. Solve for payment or PMT.
Note that “i” does not need to be adjusted for inflation as we already did that in step three, above. Also, this “i” may be higher as you are probably a more aggressive investor pre-retirement than you’ll be post-retirement. I’ll use an aggressive 9%.
Plug in the numbers and I get roughly $42,000 in annual savings required (rounded).
Every year for twenty years.
Ok, it’s not that dire. . . if you start early
$42,000 needed to save annually! That will be tough if I’m 45, plan to retire at 65, and have zero savings at present.
But what if I’m 35, with 30 years to save.
- 50K with 3.5% inflation will be 140K in 30 years
- With a 2.4% inflation-adjusted return, and 30 years of retirement, I’ll need 3.05 million at age 65.
- With a 9% rate of return, I’ll need $22,400 saved annually. Almost half the amount, with only 50% more years.
Better yet, I’m 25, with 40 years to save.
- 50K with 3.5% inflation will be 198K in 40 years (note, it doubled twice)
- With a 2.4% inflation-adjusted return, and 30 years of retirement, I’ll need 4.3 million at age 65.
- With a 9% rate of return, I’ll need only $12,700 saved annually
Yes, save as early and often as you can.
But what is your expected return rate?
Put aside inflation for the moment, what is your expected return rate?
In the example above I threw out 6% and 9%. That is probably generous. Depending on what timeframe you choose to focus on, the Compounded Annual Growth Rate of the market (specifically the S&P500) could be anywhere from 6.6% to 11%.
And that assumes you’re 100% in the market. Although reasonable when you’re young, after retirement you won’t be 100% in. You’ll be holding a percentage of bonds and cash.
One big limitation of the Annuity Method (besides all the math!) is that it is very sensitive to changes in the “i” or interest-rate variable. One teensy-tiny modification and your answer becomes very different.
In the first example, perhaps I have a 3% inflation-adjusted return, rather than 2.4%.
- Start with 99K inflation-adjusted annual expenses, like before
- With a 3.0% inflation-adjusted return, and 30 years of retirement, I’ll need only 2.0 million at age 65. Not 2.15 million.
- With a 9% rate of return, I’ll need 39,000 saved annually. This is 3K different from the 42K calculated above. Or 3 x 20 = 60K in savings over twenty years.
Also, what if you live a tad longer than 30 years. Perhaps 35 or 40 years?

Photo by Lisa Fotios from Pexels
Monte Carlo Analysis
Another problem with the annuity method is that it assumes a consistent rate of return. That’s fine when calculating reinvested savings from bond yields, but the stock market is a different animal.
What if you hit a bear market (drop of >20%) right after you retire? You’ll spend the rest of your retirement playing catch-up and may run out early.
This sequence of return risk can be addressed by using Monte Carlo Analysis. This analysis starts with an analysis like that of the Annuity Method but then runs thousands of simulations on what the market may or may not do over the next several decades. These simulations cover both your pre-retirement and post-retirement returns. The tool then spits out a success rate, or the probability you will not run out of money by a given year of retirement.
Depending on your risk tolerance, you may not require a 100% or even 95% success rate.
Here are two available tools:
I’ll try our previous example of a 45-year-old retiring at age 65, with an annual spending need of 50K, contributing $42K annually in pre-retirement savings. I’ll plug in 3% inflation and a typical 60:40 portfolio.
In 95% of all scenarios, I still have money at age 78. However, at age 95, after thirty years of retirement, I only have a 51% chance of not being broke. . .
(And before you ask, a portfolio of 100% stocks results in 95% success at a younger age of 76 and a 65% success rate at age 95.)
Indeed, if I follow a Monte Carlo Analysis, I will need to save much more than I would with the annuity analysis.

Photo by Quang Nguyen Vinh from Pexels
Withdrawal Rate Method
Although this isn’t an official method, it’s one that is discussed at length online.
Many adhere to the 4% rule. In summary, if you have a portfolio of at least 50% stock, and no more than 40 years of retirement, and—most importantly—the future behaves like the past, then a 4% withdrawal rate is reasonable.
However, one of the foremost experts on withdrawal rates, Wade Pfau, continues to run numbers. The 4% rule was based on rolling historical periods from the last century. However, in the last decade or so, bonds have paid out poorly due to low interest rates.
Running Monte Carlo simulations with “current market conditions” results in a much higher portfolio failure rate of 23% at a 4% withdrawal rate. And that is with a stock-heavy portfolio. A 3% withdrawal rate looks better, at only a 9% failure rate.
Simple math
Regardless of whether you choose 3% or 4%, the math is very simple. If you wish to retire today, you need your annual spending amount divided by 0.04 (or 0.03). Which mathematically is the same as multiplying that value by 25. 55k x 25 = 1.375 million. (Or 1.833 million if you’re going for a 3% withdrawal rate.)
You don’t need to worry about future inflation or exact return rate, because that was covered in the 4% withdrawal studies. (Again, assuming the future behaves like the past.)
Note, this is how much you need to retire right this minute. If you wish to retire in the future, you need to go back to our FV calculation to adjust for inflation. You can either inflate annual expenses or inflate total amount; both approaches will provide the answer.
- 55K x (1.035)^20 = 109K; 109 x 25 = 2.7 million, or
- 375M x (1.035)^20 = 2.7 million
Note, 2.7 million is a lot more than the 2.15 million from the annuity method example.
This number may be more generous than it needs to be, as authors, Cooley, et al, indicated, our withdrawal rates can change with circumstances, ramping down when markets are poor and partying it up when markets rally.
However, in order to determine how to get to your mythical retirement number, you still need step 5 from the annuity method, plus a reasonable rate of return for your current savings. As you already know your current portfolio allocation, this may be a bit easier to calculate.
In summary, there are several ways to calculate your retirement savings needs. And each method will spit out a different number. The best approach is to use several methods, resulting in a range. As you get closer to your retirement goal and re-tweak your assumptions, this range should contract.
Run each method several times with minor changes to the variables and see how the results change. Change the return rate up and down. Change the number of years during retirement up and down.
One of the changes that will have the biggest impact is simply working an extra year. That’s one extra year of compounded savings, and one less year of retirement.
Good luck!
Related Reading:
- The Stock Market Doesn’t Make as Much as You Think it Does. Evaluating CAGR—compound annual growth rate—over the long term.
- What is Your Portfolio Success Rate? Does the 4% rule still apply?
- Will You Run Out of Money? Closing in on retirement? How to manage your existing savings to last.
First photo credit: Plush Design Studio from Pexels

This information has been provided for educational purposes only and should not be considered financial advice. Any opinions expressed are my own and may not be appropriate in all cases. All efforts have been made to provide accurate information; however, mistakes happen, and laws change; information may not be accurate at the time you read this. Links are included for reference but should not be considered an implied endorsement of these organizations or their products. Please seek out a licensed professional for current advice specific to your situation.

Liz Baker, PhD
I’m an authority on investing, retirement, and taxes. I love research and applying it to real-world problems. Together, let’s find our paths to financial freedom.
